
Capacity
How do you know how much capacity and power you have in your data center? Where is the best place to deploy new IT equipment? When you will need more power or space? The demand for resources is on the rise in data centers and IT labs around the world. But most IT facilities only have a finite amount of space, power, cooling, and connectivity capacity to work with. So it’s more important than ever to intelligently manage the resources so that you can make more informed capacity planning decisions, use power resources more efficiently, and save on operating expenses. To do so you need an accurate and reliable way to view your capacity.
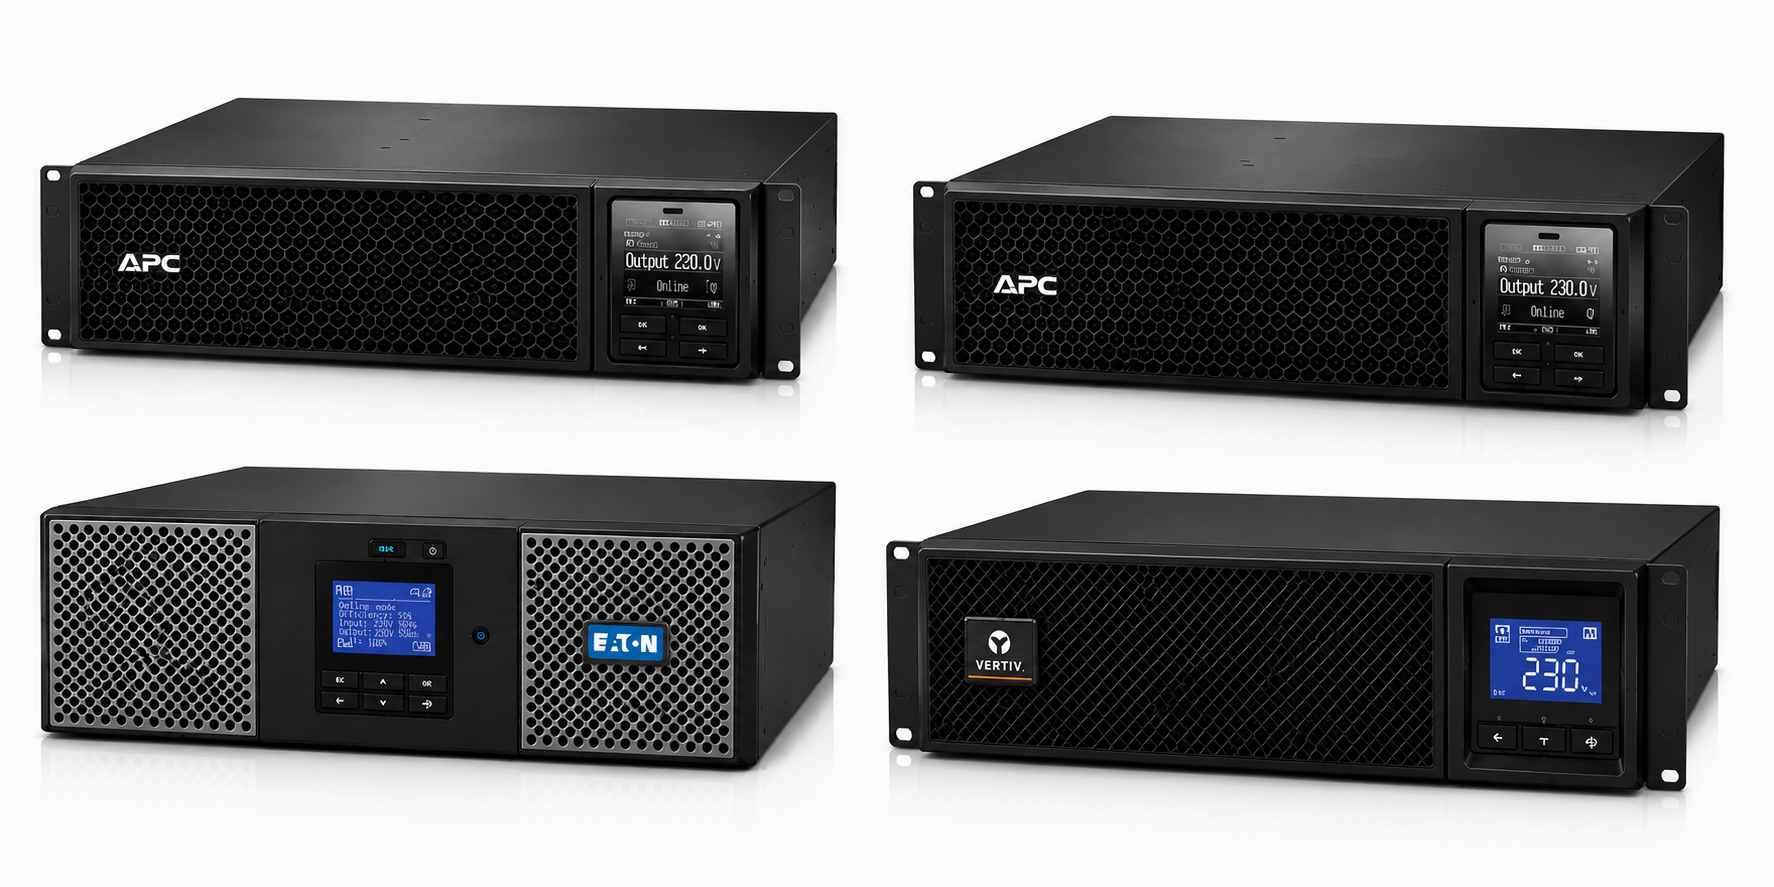
Sunbird’s Capacity Management Solution provides you with complete, accurate views of capacity, including physical space, power and network ports available in racks, plus the capacity of infrastructure devices like UPSs, CRACs, and circuit panels. Our capacity management solution includes our dcTrack® DCIM software that displays your entire power and network chain with the click of a button. You no longer need to maintain files and files of Excel® and Visio®, nor make trip after trip to the data center.
dcTrack centralizes all your data and their associated connections to greatly simplify how you find, place and reserve resources.
Request a live online demo of our Capacity Management Solution and see how easy data center capacity planning can be.
Optimal Placement
Cabinet 2C
Available continguous U space – YES
Available power outlets on rack PDU – YES
Available power capacity at rack and upstream – YES
Available network ports with media & connector match – YES
One click access to any section of your Data Center
-Color coded capacity usage
-Available Capacity
-Low Capacity
-No Capacity
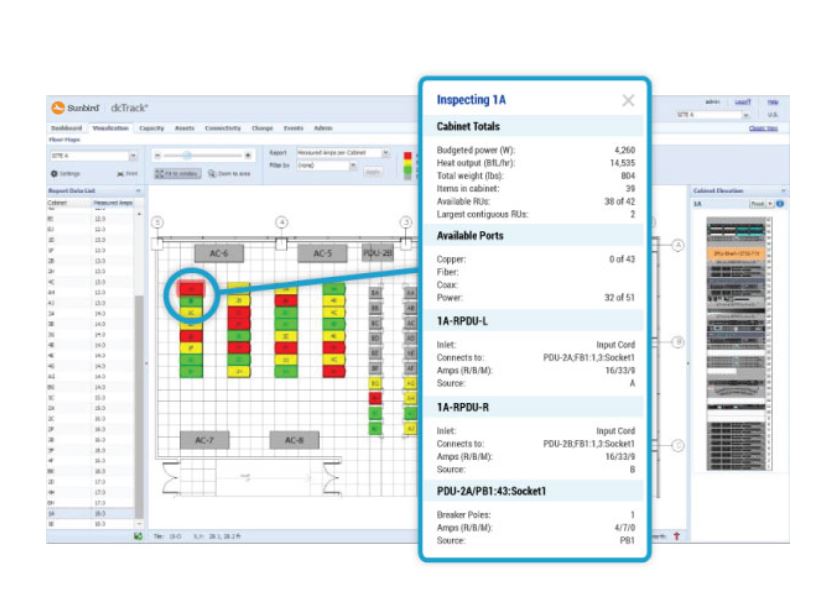
Capacity Cabinet Inspector
-Drill down from the data center health floormap and instantly get a real-time view of specific rack level details
-Quickly view important information including: available space, power, copper and fiber ports, weight, budgeted power, heat output, rack PDU details and branch circuit feeds
Everything at a glance
-A simple dashboard where you can quickly see everything
-Customizable Tiles view shows health and capacity of all your data centers on one screen
-Live charts compare real time data with budgeted data improves capacity utilization
-Drill down capability from data center level to rack level details and events