
Visualization
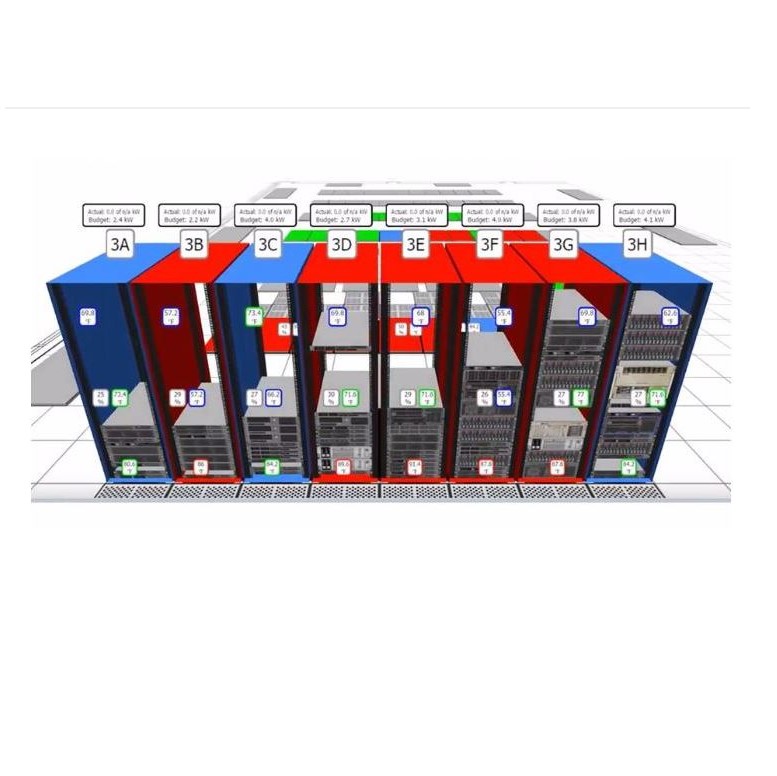
3D Data Center Visualizations
Do you think of 3D as a sales gimmick that is all style and no substance? You’re not alone. The fact is, most data center management software incorporates 3D in flashy but ultimately unhelpful ways.
But what if data-driven 3D could make it easier for you to manage your data center? With Sunbird’s data center visualizations, see 3D that’s faster, easier, and smarter than physically being in your data center.
Our DCIM solution incorporates 3D to enhance information in ways that make sense so you can get more out of your data. View cabinet elevations and see where and how devices are place and connected. Analyze power, temperature, and humidity sensor readings at a glance—information you can’t easily get when physically inside the data center. Display your visualizations in slideshow mode to create a shared understanding across organizational silos.
Worried about lag and load? 3D rendered at the speed of your browser—not by a server—ensures high performance for faster analysis.
Stop wasting time with physical trips to your data center. Test drive our DCIM solution and experience 3D data center visualizations that are both functional and beautiful.
Be the Superman of your Data Center.
-“X-ray” views enable you to see inside your cabinets
-Easily visualize the impossible: side views of all your racks without the side panels.
-Flip from the front to the back of your row with superhuman speed
-Enhance your vision with detailed model, depth, alignment, and mounting information as well as sensor data for your devices
Weather radar for your data center: Thermal and pressure maps with time-lapse video.
Forecast and address changes in your data center environment with speed and accuracy.
-Spot temperature and humidity trends over time across your entire data center floor map
-Identify and predict hotspot formation—from start to end points
-Works with environmental sensors already deployed in your data center for easy data collection and high-quality data
Feel better and sleep better knowing that Sunbird DCIM is continuously monitoring the health and status of all your data centers.
-Easily see the health of all your sites in one view with simple red-yellow-green color coding.
-Quickly drill down to understand the events that trigger threshold alerts.
-Achieve optimal data center health with multi-site monitoring across all your locations.
-Customize views with drag-and-drop ease and resize tiles to fit all your data centers on one screen.
-Take the stress out of tracking changes in your data centers with user-configurable notifications.
-Rapidly sort, filter, and clear all of your events in a single view.